
A Cost Structure Cheese Grater for Businesses
A quick, simple and inexpensive method of computing the indirect costs for pricing, bidding and estimating for small shops.
Share
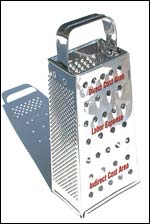
Figure 1. A cost structure cheese grater for businesses. Figures courtesy of RWSMC Consulting.
Figures 2 and 3. An understanding of the gross margin analysis model.
Notice on the cheese grater in Figure 1 that all the holes are uniform openings to ensure that the cheese one passes over it is grated to the proper or desired size. Every push of the block of cheese fills a bowl under it and will eventually provide a piece of cheese that is too small to grate. For those of us that remember them, this was the way we obtained shredded cheese (not in a bag already grated). For those who do not remember, try it but watch your fingers—those openings have very sharp edges on them.
Now let’s look at the cheese grater as a currently used cost structure, where the large holes at the top are the direct cost area, the small holes at the bottom are the indirect cost area, and that large slice portion in the middle is the labor cost. Every time your revenue stream comes in, it is passed against this grater for each mold sale that you make, and that piece left over (usually small) is your net profit for each sale.
The customer is the one who pushes the revenue dollar against the business cheese grater. Some customers push harder overall than others, and some will push harder against certain parts of the grater than others will.
The cheese grater illustrates that not every cost is uniform. Using tend analysis, one can find that there is a mixture of different costs for each product you make, which means those direct costs can vary from customer to customer, from machine to machine and from direct labor hours to direct labor hours. The same holds true for the labor cost and the indirect cost area. Even fixed indirect cost can vary based upon the number of products being made and the cost to maintain the equipment.
Let us look at this cheese grater again, this time instead of labor taking a large slice of the cheese in the middle, use it as the gross margin line where the expenses of sales general and administration (SG&A) and management are the smaller holes. Somehow one has to figure out what percentage of that incoming stream of cash will cover those smaller holes and still leave a piece for profit. For most situations, this resembles the current profit and loss statements used within the U.S., according to Generally Accepted Accounting Principles (GAAP).
Examine Your Latest Budget Analysis
Can we believe that each individual expense will be the same no matter what product the firm makes or the customer served? Is every one of the departments in the SG&A area consuming an equal portion coming from those small holes, or are some departments actually consuming more than other departments? Do you know?
Look at your latest budget analysis where actual cost is compared to the planned cost. Is every part of that budget analysis meeting the planned cost or are there some areas that are either less than the plan or more than the plan? I’ll bet there are variances, since we cannot see into the future. And most budgets are developed using trend analysis over the last few years (or through someone’s best guess).
2005 is a prime example. Who knew that we would have two major hurricanes that hit the gasoline refineries on the gulf coast? Who knew that the cost of a gallon of gasoline would increase so high, making everything else go up? If I knew, I would have made more than my share of cash flow buying gasoline futures two weeks prior to Hurricane Katrina coming ashore.
Activity-Based Gross Margin Analysis
Okay, we have determined that every cost is not equal to the planned cost we thought would get us through the year, yet we keep using that same cheese grater to break down the incoming cash to feed those areas. Why? There is a relatively easy way to determine where the cost is actually going that provides a picture of the true cost of the products being made—maybe not precise down to six decimal points, but accurate enough down to the penny. This method also takes those indirect costs (those overhead costs) and shows how they relate to the direct cost, so there will no longer be a need for those small holes in the cheese grater.
What’s needed is a quick, simple, and inexpensive method of computing the indirect costs for pricing, bidding, and estimating. An activity-based costing analysis of the gross margin is just the ticket for this.
Step 1
An activity-based gross margin analysis starts with an interview with the heads of each department (or their knowledgeable representative). We are not concerned with the direct production department(s) here—only with the departments that provide indirect (overhead) support to the direct production departments. One reason for the simplicity of an activity-based gross margin is because you exclude the direct production departments from the activity analysis.
The goal of the departmental interviews is to determine the resources that are available in each indirect department and to identify the significant activities (those that consume at least 5 percent of each department’s time or resources) that are carried out by each department. Then you get departmental estimates for the amount of time and resources consumed in each significant activity. There will generally be five to 10 significant activities carried out by each department. In some cases, it may be better to base the analysis on cost centers instead of departments, if the business is focused more on cost centers.
Step 2
The next task is to develop the cost pools and activity drivers that will be utilized by the gross margin analysis model. As you look at the activities that you have developed, you will probably find that they fall into logical groups or pools. Except for the direct production process, many organizations carry out similar basic functions, and you are now looking to classify the activities that you have identified into these basic functions. Just as an entire department can serve as a single activity, it also can serve as a single departmental pool—purchasing or sales can be examples of a departmental cost pool—provided no other departments conduct significant activities that also involve purchasing or sales activities. Using a department as a cost pool will especially apply to smaller businesses and organizations or when time/budget constraints prevent a very detailed analysis. Keep in mind that we are only after reasonable accuracy here—not excessive and costly precision or “paralysis by analysis.”
Some common indirect (overhead) cost pools are purchasing, sales, engineering and shipping. There also can be cost pools for expediting or other special treatment required to support sales orders and other functions. Administrative, accounting, managerial, advertising, grounds/building maintenance, and similar activities can go into a “business sustaining” cost pool. There will usually be at least one cost pool for activities that provide significant technical or other support to the direct/production department(s) but whose cost doesn’t go into the direct cost of the final product. You can call this cost pool production support, manufacturing support—or a more descriptive name such as assembly support.
The thing to keep in mind in developing the cost pools is that you are trying to group activity costs into cost pools that describe common methods, intensity or capabilities of support provided to carry out the business and to provide indirect (that dreaded overhead) support of the production process.
Step 3
After you have developed the cost pools, the next task is to determine the activity cost driver of each pool. A cost driver is the reason why the cost is incurred—in other words, the cost is incurred in producing the driver. Look at each cost pool you have developed and see what product it turns out. More than likely, that product is the driver for the cost pool. If you have a purchasing pool, for instance, the driver might be the number of purchase orders prepared in support of a job. The more purchase orders required for a job, the more support will be required from the purchasing pool.
The activity cost driver of a pool will generally be fairly easy to determine from the nature of the pool. In some cases, the driver might be the number of line items—such as the number of line items on a single order to be pulled from stock—or the number of line items on the primary departmental document produced. The objective in selecting a driver is to pick a logical and common sense reason or cause that is responsible for incurring costs in the cost pool.
After you determine the activity driver for a pool, divide the total drivers produced in the pool by the total cost of the pool to get a cost per driver. You will make further use of the cost per driver in the gross margin analysis model.
Step 4
After developing the cost pools, identifying the activity drivers of each pool and calculating the cost per driver, the final task is to prepare the gross margin analysis.
The gross margin analysis computes the gross margin by sub-tracting the direct product cost (the large holes in the cheese grater) from incoming revenue. It also shows the business cost pools, the cost for each driver and the driver quantity for each cost pool.
The gross margin analysis computes the indirect/overhead activity cost by multiplying the number of drivers required by the cost of each driver. It subtracts the total activity cost for the cost pools from the gross margin to compute a pre-tax profit. It also can compute a breakeven price and the sales price needed to achieve a targeted pre-tax profit amount.
The gross margin analysis model is very flexible and can be used to analyze product sales, customer sales, sales by geographical area, or any other sales category for which you can get sales prices, direct costs and driver quantities.
An additional use of the model is to determine the sales price needed to produce a target profit for each sales category. In addition to analyzing sales, the gross margin analysis model can be used for bidding, estimating and studying profitability. Review the spreadsheets in Figures 2 and 3 for a better understanding of the gross margin analysis model.
Becoming More Knowledgeable
The gross margin analysis model doesn’t require expensive computer software—as it is an easy to understand model consisting of several spreadsheets. Any change in pricing that is indicated by the model can be made quickly and with minimal cost. It is just one example of the many practical and common sense benefits offered by activity-based costing to businesses that go to the trouble of understanding it and then make the effort to employ it to become more knowledgeable about their business. And, it shows which holes in that cheese grater at the top of this article are actually larger or smaller than you think.


Related Content

Mold Builder Uses Counter-Intuitive Approach for Mold Challenges
Matrix Tool Inc. answers customers’ hard questions with creative solutions for cavity spacing, tool sizing, runner layout and melt delivery that reveal the benefits of running in a smaller press size at lower cavitation but higher yield.
Read More
OEE Monitoring System Addresses Root Cause of Machine Downtime
Unique sensor and patent-pending algorithm of the Amper machine analytics system measures current draw to quickly and inexpensively inform manufacturers which machines are down and why.
Read More
Editorial Guidelines: Editorial Advisory Board
The Editorial Advisory Board of MoldMaking Technology is made up of authorities with expertise within their respective business, industry, technology and profession. Their role is to advise on timely issues, trends, advances in the field, offer editorial thought and direction, review and comment on specific articles and generally act as a sounding board and a conscience for the publication.
Read More
Making Quick and Easy Kaizen Work for Your Shop
Within each person is unlimited creative potential to improve shop operations.
Read More