North America contains the two largest trading partners for the U.S. plastics industry—Mexico and Canada. In 2012, these two countries were the destination for $13.6 billion and $12.5 billion worth of U.S. plastics industry exports, respectively. Combined, this represented 31 percent of total U.S. plastics industry exports in 2012.
North America contains the two largest trading partners for the U.S. plastics industry—Mexico and Canada. In 2012, these two countries were the destination for $13.6 billion and $12.5 billion worth of U.S. plastics industry exports, respectively. Combined, this represented 31 percent of total U.S. plastics industry exports in 2012.
Macroeconomic Overview
Mexico
The Mexican government of President Enrique Peña Nieto, who has been in office since December 2012, has set an ambitious course of economic and social reforms for which it seems to have built a broad-based consensus. Government policies over the past several years have positioned Mexico well in terms of macroeconomic and financial performance, although economic growth remains less than adequate and more needs to be done to improve overall well-being.
Mexico’s macroeconomic policies appear sound, and its credibility within financial markets has helped the country avert any lingering consequences from the global financial crisis of 2008-2009. The economy has been growing at higher than its potential rate since 2010, thanks to a fast recovery from that financial crisis.
This economic growth has been fueled by expanding domestic demand for Mexican products and greater export market penetration, along with substantial improvements in relative unit labor costs, driven by moderate wage increases. This has been accompanied by an improved employment situation. Gross domestic product growth is expected to gradually strengthen to more than 3.5 percent this year, as world and especially U.S. demand picked up in late 2013 and is expected to continue.
A maquiladora or maquila is the Mexican term for manufacturing operations in a free-trade zone (FTZ), where factories import material and equipment on a duty-free and tariff-free basis for assembly, processing or manufacturing, and then export the assembled, processed and/or manufactured products, sometimes back to the raw materials’ country of origin. Currently, about 1.3 million Mexicans are employed in the approximately 3,000 maquiladoras.
In 1964, the Mexican government launched the Border Industrialization Program (BIP) or Maquiladora Program to solve the problem of rising unemployment along its U.S. border. The maquiladoras were attractive to U.S. companies as a source of cheap labor, and because of devaluation of the peso and favorable changes in U.S. customs laws. In 1985, maquiladoras displaced the tourism industry as the largest source of foreign exchange, and since 1996 they have remained the second-largest industry in Mexico behind the petroleum industry.
The North American Free Trade Agreement (NAFTA) enacted in 1994 favorably impacted the growth of maquila plants. During the five years before NAFTA, maquila employment grew at a rate of 47 percent; this figure increased to 86 percent in the next five years. In 2001, the number of maquila plants grew from about 2,700 to about 3,700.
The industry has become an important source of foreign direct investment (FDI) and foreign exchange for Mexico. In the 2000s, the Mexican maquila industry faced increasing competition from other countries with cheap labor sources, including Malaysia, India and Pakistan. The biggest threat came from China’s Special Economic Areas. However, higher labor costs in China and the resurgence of the North American automobile and consumer electronics markets have made the maquiladoras attractive once again, resulting in a significant amount of near-shoring of U.S. manufacturing from China to Mexico.
Canada
Canada weathered the global economic crisis of 2008-2009 well, and its economy also is continu-ing to grow due to several factors. Financial markets see the country’s federal fiscal plans as credible, facilitating low borrowing costs. The banking system appears sound and required no taxpayer bailouts during the crisis. Comparatively strong growth among emerging market economies has resulted in higher export prices and stronger foreign currencies, shifting global purchasing power to commodity exporters like Canada.
Canadian unemployment also has fallen substantially since the recession peak and is now near its long-term average rate as well as its structural rate, and real business investment and corporate profit margins have been restored to pre-crisis levels.
The short-term outlook for the country is for relatively moderate economic growth at just above potential rates and a slight upward tilt as external demand becomes increasingly supportive. Planned fiscal consolidation will be beneficial for market confidence and for longer-term sustainability, but could weaken Canada’s domestic demand.
Ease of Doing Business
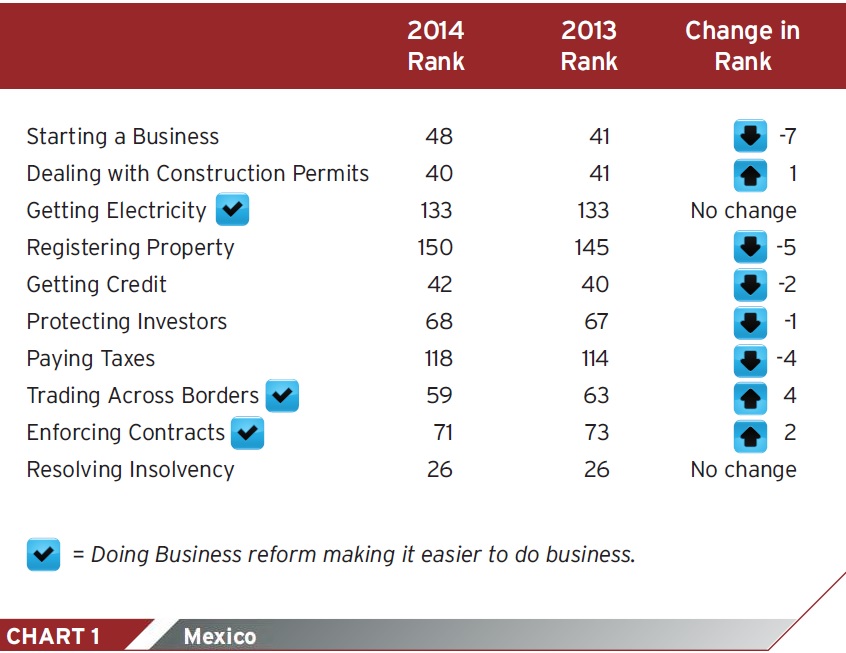
The World Bank has developed an index that ranks 189 economies on their ease of doing business. A high ranking on this Ease of Doing Business Index means the regulatory environment is more conducive to the start and operation of a local firm. The index averages the country’s percentile rankings on 10 equally weighted topics, made up of a variety of indicators. Countries are also ranked in each topic.
Although it is not specific to the plastics industry or exclusively regulatory in focus, this index provides an excellent benchmarking tool to assess a country’s general business climate/environment over time and in comparison to other export markets.
Mexico
In 2013, Mexico’s Ease of Doing Business rank dropped slightly from 51 to 53 (see Chart 1).
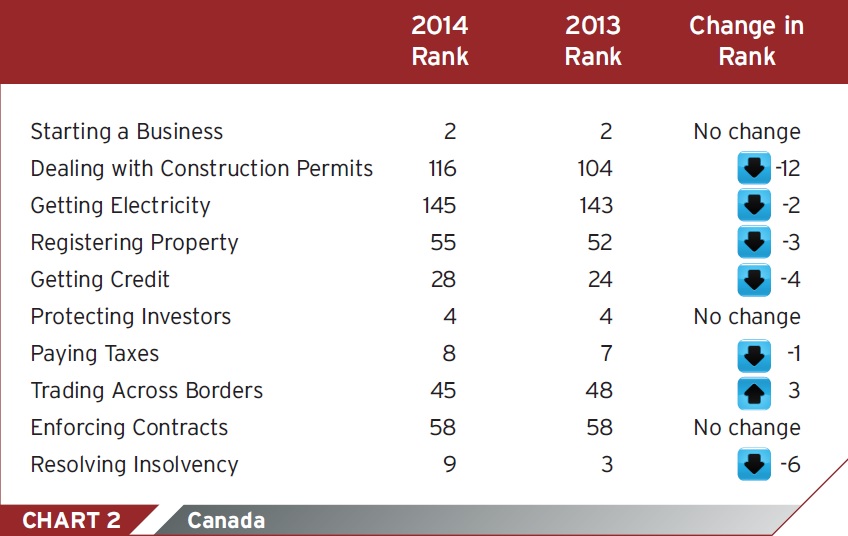
Canada
In 2013, Canada’s Ease of Doing Business rank dropped slightly from 17 to 19 (see Chart 2).
U.S. Plastics Industry Exports
Mexico
From 2000 through 2012, U.S. plastics industry exports to Mexico grew by 84.8 percent from $7.4 billion to more than $13.6 billion. From 2011 through 2012, total plastics industry exports increased by 9.4 percent, and from 2012 through October 2013, they went up by almost 9 percent more.
Although in 2012, the U.S. plastics industry exported goods valued at more than $13.6 billion to Mexico, plastics imports from Mexico also rose 7.2 percent to $3.6 billion, yielding a positive trade balance overall of $10 billion.
U.S. plastics industry exports in 2012 by core segments were:
Resins: $6.8 billion (5.7 percent increase)
Products: $6.2 billion (12.3 percent increase)
Machinery: $196 million (23.2 percent increase)
Molds: $352 million (33.7 percent increase)
From January through October 2013, the U.S. plastics industry exported goods valued at more than $12.5 billion, up 8.8 percent from the same period in 2012. Plastics imports from Mexico were up 6.8 percent to $3.3 billion, yielding a positive trade balance overall of more than $9.2 billion.
From January through October of 2013 the core segments showed:
Resins: $6.2 billion (6.3 percent increase)
Products: $5.8 billion (11.9 percent increase)
Machinery: $172 million (7.2 percent increase)
Molds: $316 million (4.8 percent increase)
Canada
From 2000 through 2012, U.S. plastics industry exports to Canada grew by 66.9 percent from $7.5 billion to $12.5 billion. From 2011 through 2012, total plastics industry exports increased by 2.9 percent, and from 2012 through October 2013, they decreased by 0.3 percent.
In 2012, the U.S. plastics industry exported goods valued at $12.5 billion to Canada, while plastics imports from Canada were down 0.1 percent to $11.1 billion, yielding a positive trade balance overall of $1.4 billion.
U.S. plastics industry exports by core segments in 2012 were:
Resins: $5.9 billion (0.3 percent increase)
Products: $6.3 billion (5.4 percent increase)
Machinery: $212 million (13.5 percent increase)
Molds: $107 million (10.7 percent decrease)
From January through October of 2013, the U.S. plastics industry exported goods valued at $10.6 billion, while plastics imports from Canada were up 5.5 percent to $9.8 billion, yielding a positive trade balance overall of $800 million.
From January through October of 2013, breaking down the industry into core segments again, we see the following:
Resins: $5.0 billion (1.0 percent decrease)
Products: $5.4 billion (0.8 percent increase)
Machinery: $169 million (4.9 percent decrease)
Molds: $74 million (18.7 percent decrease)
Export Opportunities for Moldmakers
Mexico
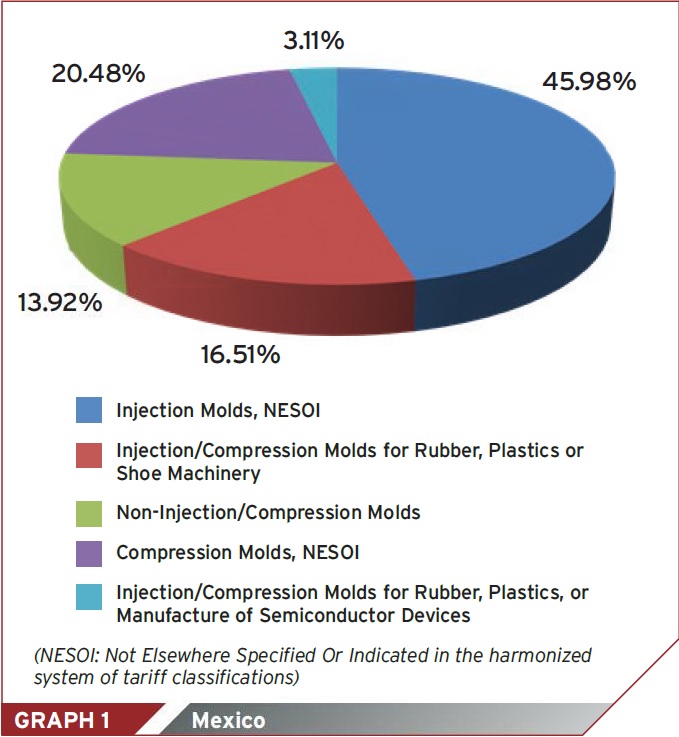
There has been growth in the demand for U.S. molds in Mexico, and there remain opportunities. This growth has been spurred by the economic resurgence of the maquiladoras discussed earlier and driven by increased demand in the North American automobile and consumer electronics sectors. Graph 1 shows the breakdown in U.S. molds exports to Mexico for 2012 by type.
From January through October 2013, U.S. plastic mold exports to Mexico experienced additional significant growth over the same time period in 2012. Injection molds rose 27.5 percent to $145 million, and compression molds increased 10.7 percent to $65 million (NESOI: Not Elsewhere Specified Or Indicated in the harmonized system of tariff classifications).
Unfortunately, the growth discussed in the previous sections may slow somewhat as a result of new tax policies enacted by the Mexican government. Mexico’s much-anticipated tax reform bill includes measures affecting the direct and indirect taxation of corporate taxpayers. These reforms, passed in October 2013, cancel a phased cut in the corporate income tax that was enacted under previous legislation, so corporate tax will remain at 30 percent in 2014 and subsequent years.
Important changes were also made to Mexico’s maquiladora tax structure. The tax reform bill tightens the criteria by which a company qualifies for the maquiladora standing of permanent establishment tax exemption.
It was also decided that goods produced within maquiladoras that are sold to non-residents would remain exempt from a value-added tax (VAT). Temporary imports to maquiladoras, which are used by companies to make taxable supplies, will now be subject to an input VAT that will be immediately refunded through a 100-percent tax credit.
The chill that may occur in maquiladora activity as a result of these tax reforms may make reshoring a more attractive option for U.S. manufacturers, thus potentially producing additional demand for molds domestically as well.
Canada
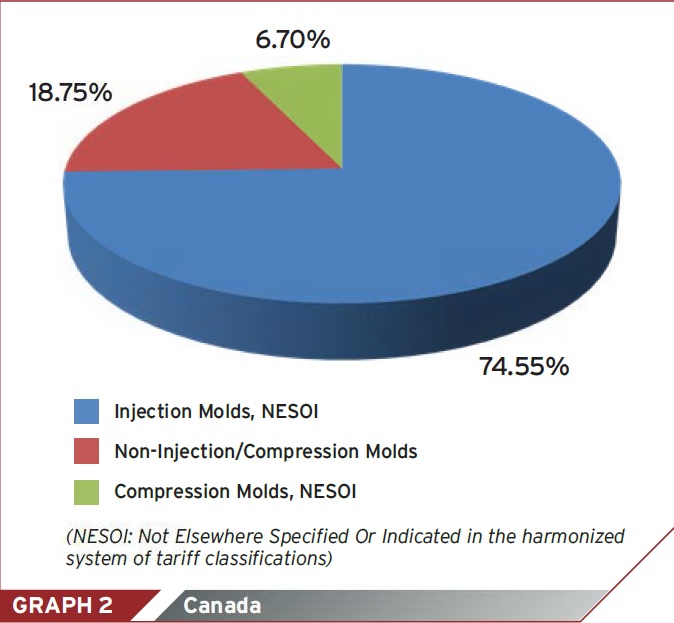
Demand for U.S. molds and the potential for future growth in Canada is quite a contrast to Mexico. U.S. mold exports to Canada were down 63.3, 10.7 and 18.7 percent in all three of the time periods of 2000 through 2012, 2011 through 2012, and 2012 through October 2013, respectively. Current economic trends and indicators do not support a major reversal of fortunes here for U.S. moldmakers.
Graph 2 shows the breakdown in U.S. molds exports to Canada for 2012 by type. The only growth in U.S. molds exports to Canada was from 2012 through October 2013 in non-injection/compression molds, with a 49.1 percent increase from $9.3 million to $13.9 million.
The next installment in this series will be published in May and will include a review and analysis of the Central and South American markets.
Global Market Opportunities for U.S. Moldmakers: NAFTA Webinar
Wed, Mar 26, 2014 2:00 PM - 3:00 PM EST
Sponsored by:
North America contains the two largest trading partners for the U.S. plastics industry -- Mexico and Canada. In 2012, these two countries were the destination of $13.6 billion and $12.5 billion worth of U.S. plastics industry exports. This webinar examines the industry trade in these two markets focusing on opportunities for U.S. moldmakers. In this quarterly webinar series, you will learn about export markets specifically attractive to U.S. mold manufacturers, and how to size up these market opportunities comparatively. Each webinar will focus on a geographic region or grouping of top export markets. Participate in all four webinars and you will have an excellent strategic vision of what foreign markets you should explore to grow your sales beyond the domestic U.S. market including: • Trade policy updates • Top export growth markets • Exporting basics and developing an exporting strategy • Costs associated with exporting • And much more!
The correlation between the units of measure used to define mold surfaces is a commonly raised question. This article will lay these units of measure side by side in a conversion format so that companies can confidently understand with what they are dealing.
What exactly does a hot runner do? If you’ve been in the injection molding industry for any length of time, you might think the answer is obvious, but it is not.
Presentations will cover 3D printing for mold tooling, material innovation, product development, bridge production and full-scale, high-volume additive manufacturing.


 North America contains the two largest trading partners for the U.S. plastics industry -- Mexico and Canada. In 2012, these two countries were the destination of $13.6 billion and $12.5 billion worth of U.S. plastics industry exports. This webinar examines the industry trade in these two markets focusing on opportunities for U.S. moldmakers. In this quarterly webinar series, you will learn about export markets specifically attractive to U.S. mold manufacturers, and how to size up these market opportunities comparatively. Each webinar will focus on a geographic region or grouping of top export markets. Participate in all four webinars and you will have an excellent strategic vision of what foreign markets you should explore to grow your sales beyond the domestic U.S. market including: • Trade policy updates • Top export growth markets • Exporting basics and developing an exporting strategy • Costs associated with exporting • And much more!


